Financial Strength
Operating Performance
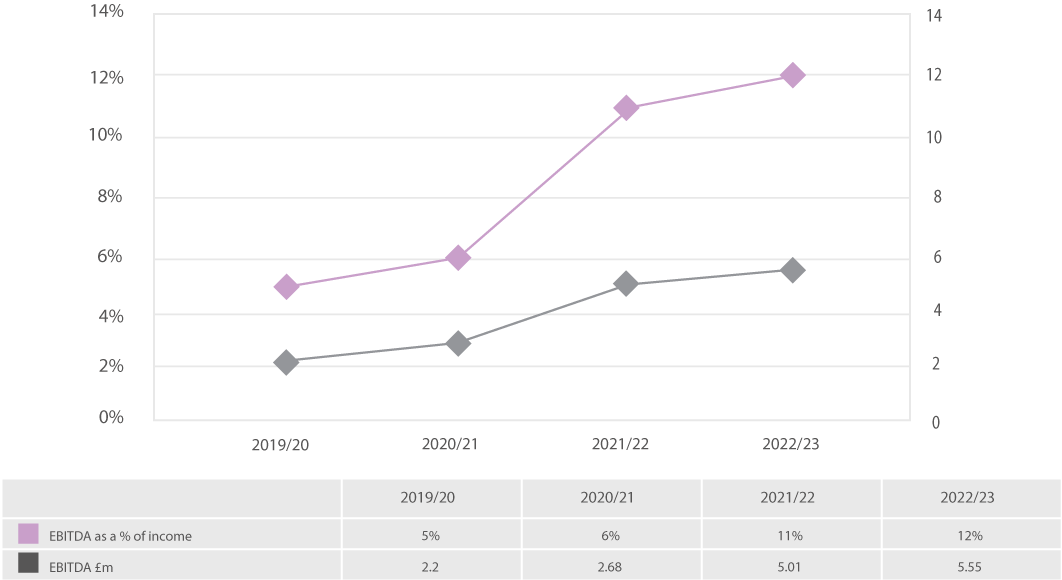
The education specific EBITDA as a percentage of income is a measure of the underlying operating strength of the college. The higher the percentage measure, the stronger the operational performance. A measure of 8% and above is the recognised benchmark by the FEC
The investment made by the college in our Dudley and Brierley Hill Learning Quarters resulted in growth in learner numbers and income. EBITDA has improved by ensuring costs are aligned to recruitment and teaching delivery.
Total Income
Total Income (£m)
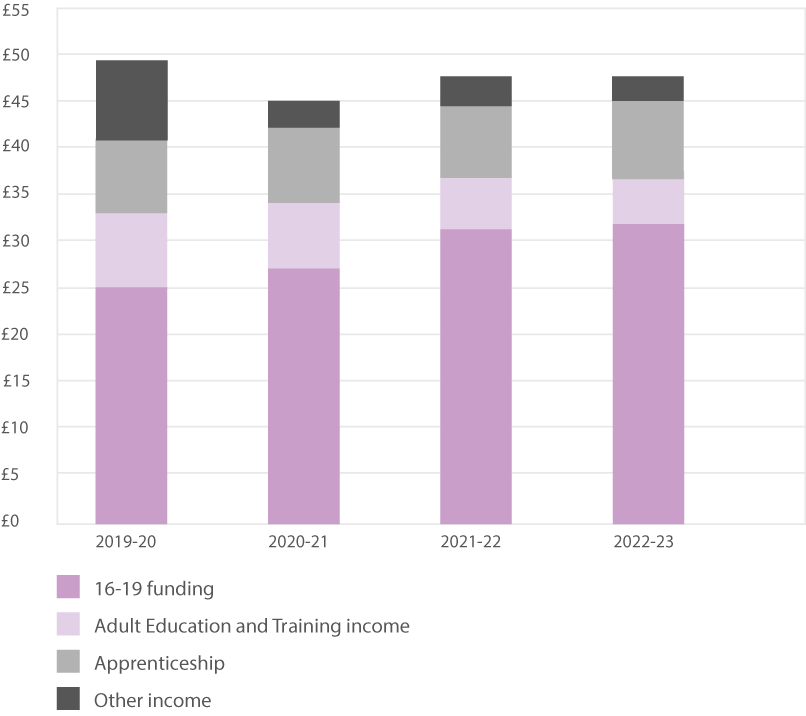
We continue to see small increases in income since the drop to £46m during the pandemic. The increase in income in 2023 is largely driven through higher levels of ESFA funding for students aged 16-19 and this will continue to grow in 2024, as a result of the growth in students in 2023.
Staff Cost as a Percentage of Income
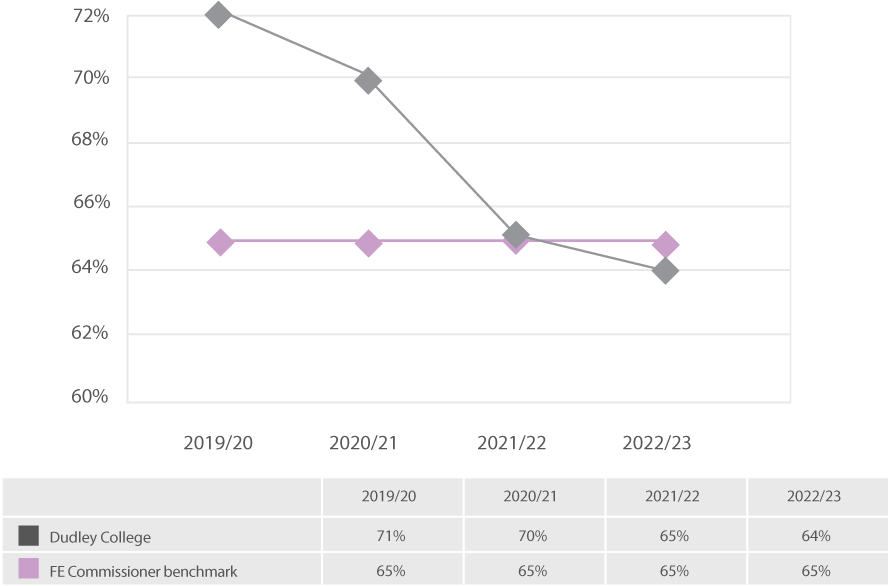
The College continues to meet the AoC recommended pay awards for staff, additional funding has been made available in 2023 to fund a cost of living increase of 6.5%. Pay costs continue to be tightly controlled and some minor restructuring in 2023 has ensured that the College’s establishment effectively matches resource requirements.
The college has also been mindful of the need to retain staff with specialist skills in order to remain flexible and respond to emerging demand in the adult and apprenticeship market. Inevitably this puts pressure on pay budgets and increases the risk of carrying vacancies for skilled staff.
The controls over pay spending will ensure a continued alignment of pay costs with delivery requirements and means that the college remains at or below the FEC benchmark of pay being 65% of turnover.
Adjusted Current Ratio
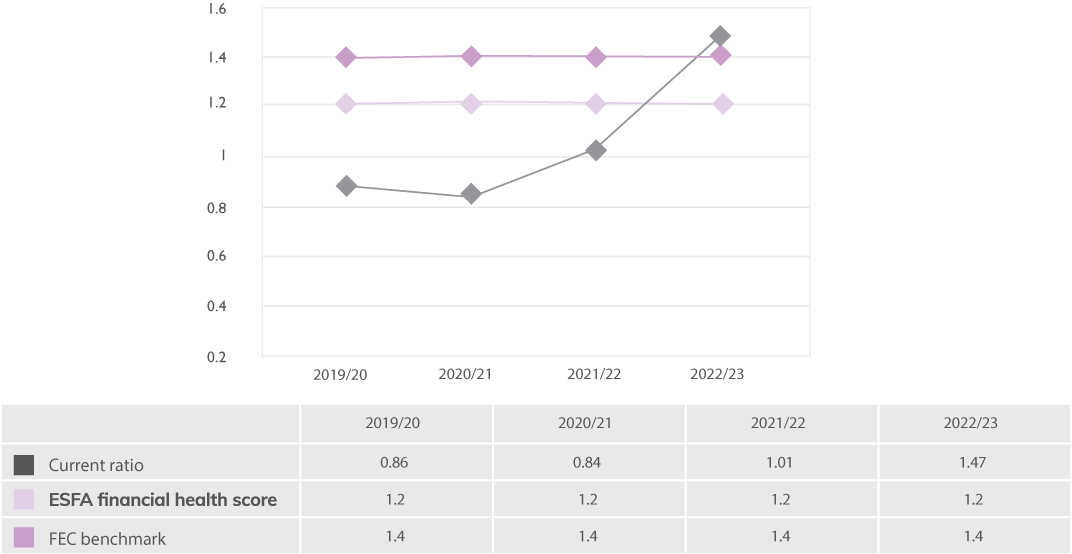
The current ratio is a measure of current assets compared to current liabilities and is used as an indicator of short-term liquidity. Whilst not a direct measure of cash, the higher the percentage measure, the better a college’s liquidity, which means the more cash, or assets that can be easily converted into cash, a college has got compared to its short-term liabilities. The ESFA ‘good’ benchmark is a current ratio of 1.2, whilst the FEC benchmark is 1.4, which the College has exceeded in 2023.
The focused spend on capital projects in 2023, supported by grants from DfE and Salix has resulted in an improved cash position and therefore a better current ratio. Cash management will continue to be important going forward as we balance the College’s liquidity needs against the requirement to repay short term borrowing. We anticipate that the College’s current ratio will continue to be strong over the next few years as the college maintains control on costs, targets capital expenditure and has a prudent repayment plan of short term borrowing.
Cash Days
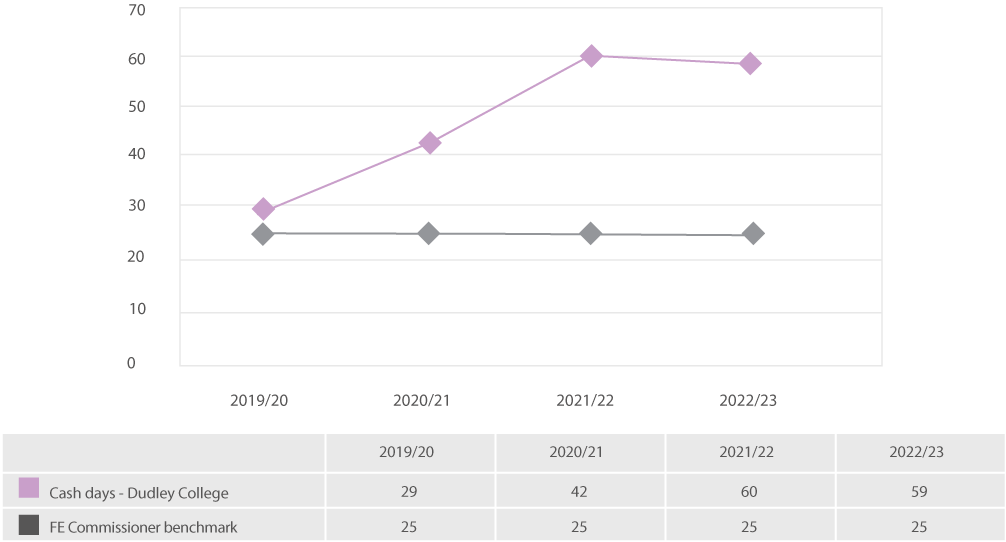
Cash days is the number of days that an organisation can continue to pay its operating expenses given its current level of available cash. The FE Commissioner’s benchmark is for colleges to have sufficient cash to cover 25 cash days.
Strong cash generation from operating activities supported by a re-structure of our bank loan facilities helped improve the college’s cash days since 2020. Closely managed cash balances, capital investment and costs, has helped to maintain the year-end cash balance and cash days to 59 at 31 July 2023, well above the FE Commissioner benchmark of 25, and facilitated early repayment of some short term borrowing.
Cash management will continue to be imperative going forwards as we navigate through an economically challenging period. We anticipate that cash, and cash days, will be maintained above the FEC target of 25.
Borrowing as a % of Income
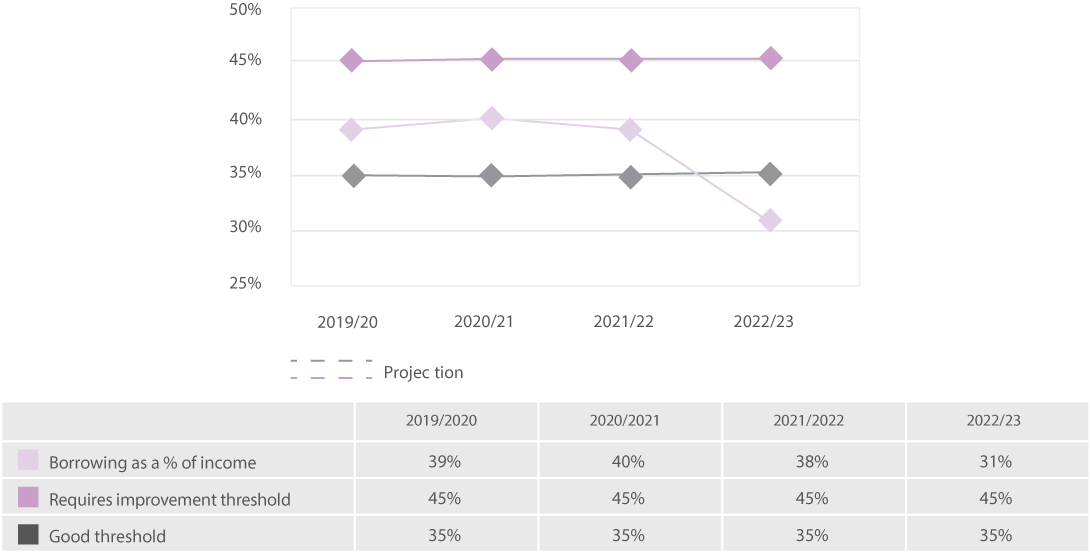
Borrowing as a percentage of income (also known as gearing or leverage) is used to measure the proportion of assets invested in a college that are financed by borrowing. It also provides an indicator to the longer term financial stability of a college, because the higher the level of borrowing, the higher the risk to a college since more cash will have to be set aside to meet debt and interest repayments leaving less cash for everything else. The lower the percentage measure, the better a college’s gearing and its prospects for long term stability. Colleges with a financial health score of Good are likely to have borrowing at 35% of income or less.
As a result of the ONS reclassification of FE colleges to the public sector, the college had sufficient cash during the year to repay its commercial revolving credit facility of £3.5m and replace with a short term loan with DfE of £1.25m. The DfE loan will be fully repaid by 2026. This has supported the College’s strategy of continuing to reduce reliance on borrowing and as a percentage of income, borrowing has dropped from 38% to 31% in 2023.
ESFA Financial Health Grade
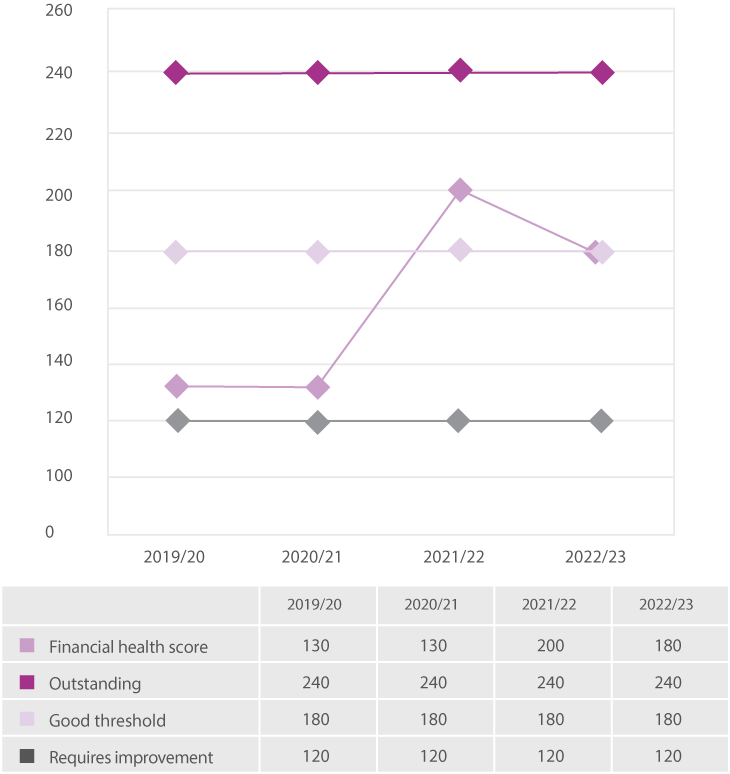
The College’s financial health grade is assessed by scoring the adjusted current ratio, EBITDA as a percentage of adjusted income and borrowing as a percentage of income. The total scores provide an overall financial health grade, based on a banding structure illustrated in the chart.
The improved operating position and higher cash levels have resulted in a strong increase in financial health score with the College approaching the Outstanding band.
The College expects to maintain its Good financial health score into 2024.
