Apprenticeships and Work Based Learners – Achievement (2022-23 Year-End)
Outcomes for Apprentices
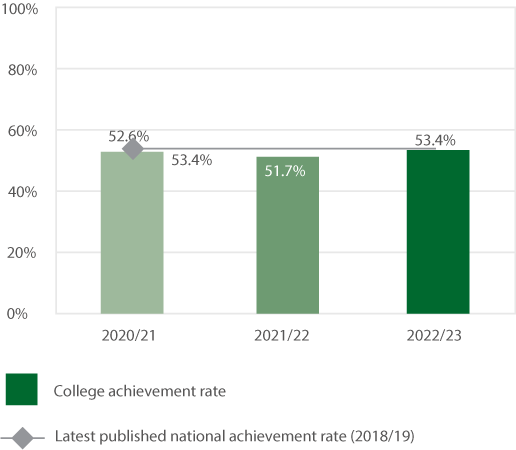
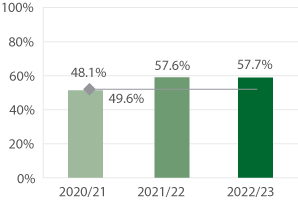
Overall achievement rate – all Apprenticeships
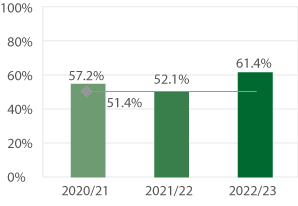
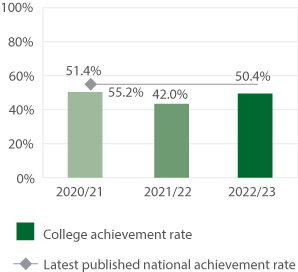
Intermediate Apprenticeships
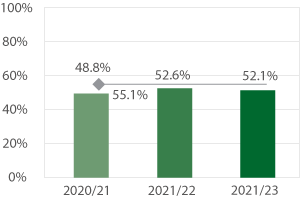
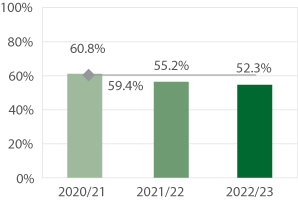
Advanced Apprenticeships
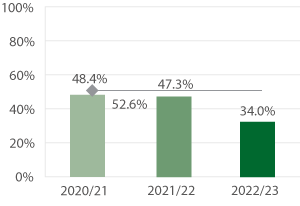
Higher Apprenticeships
Overall achievement rates for apprenticeships have slightly increased from the previous year 53.4% (+1.7%). The biggest increase is seen at intermediate level. Retention is the biggest factor affecting achievement rates. Most commonly due to changes in employment status. Top three withdrawal reasons are ‘Personal: I gained employment/job change’, ‘Loss of job/Unemployed’ and ‘Redundancy (with official employer evidence)’. Even removing just these apprentices from data shows the significant impact on achievement.
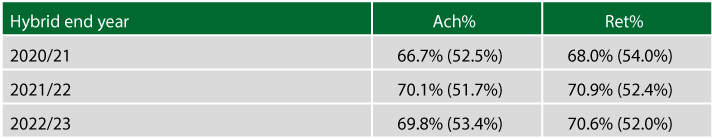
Unaltered rates are shown in parentheses.
Apprenticeship Pass Rates
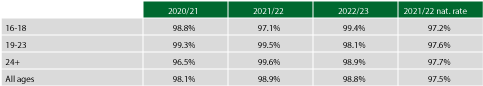
Pass rates for apprentices remain very high across apprenticeship provision.
Whilst we are aware we need to improve the number of apprentices completing within the given duration we can report that 98% of apprentices who go beyond end date do pass.
Aged 16-18 – all levels
Aged 19-23 – all levels
Aged 24+ – all levels
Analysis by age group shows underperformance in 16-18 and 19-23 age groups although a slight improvement in 16-18 compared to last year (+8.4%), 24+ has remained the same. We are committed to growing high value-added college-delivered apprenticeships where local and regional needs exist.