Higher Skills Learners – Diversity (2023-24 Year-End)
Impact on Diversity and Inclusion
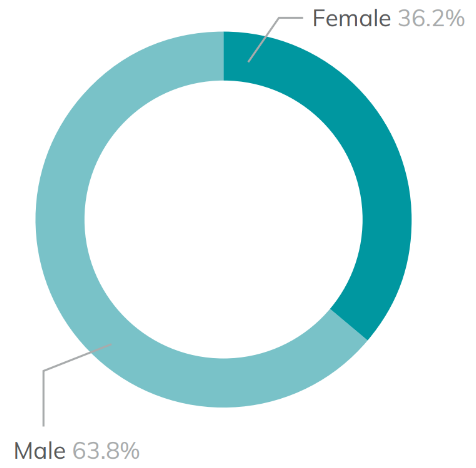
Gender
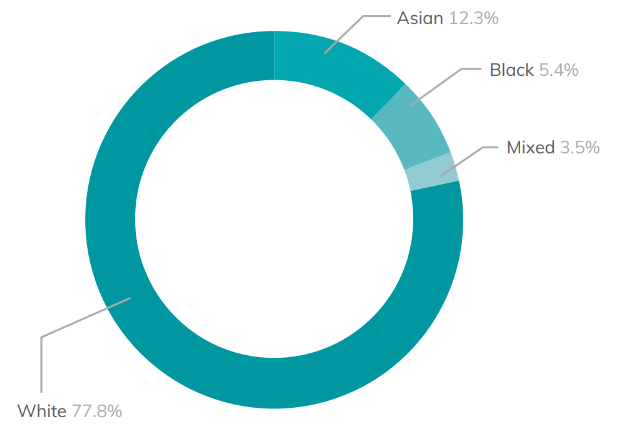
Ethnicity
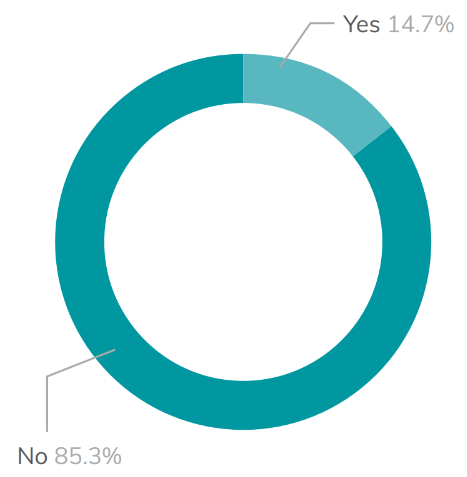
Learning difficulty or disability
Males remain the biggest cohort on Higher Education programmes, with this percentage increasing in 2023/24. We continue to encourage more female students to pursue higher technical skills, particularly in areas such as engineering, manufacturing and construction. But more works needs to be done to increase female participation in higher level study.
Their ethnicity profile shows our higher-level students as a group are more diverse than the local community. 22% of our HE students are from BAME groups compared to 11.9% of the local population.
We were pleased to support nearly 14.7% of higher-level students who have a self-declared learning difficulties or disabilities in 2023/24, a slight decrease from 2022/23. We are happy to report that these students achieved at a rate comparable to their peers.