Financial Health Indicators
Operating Performance
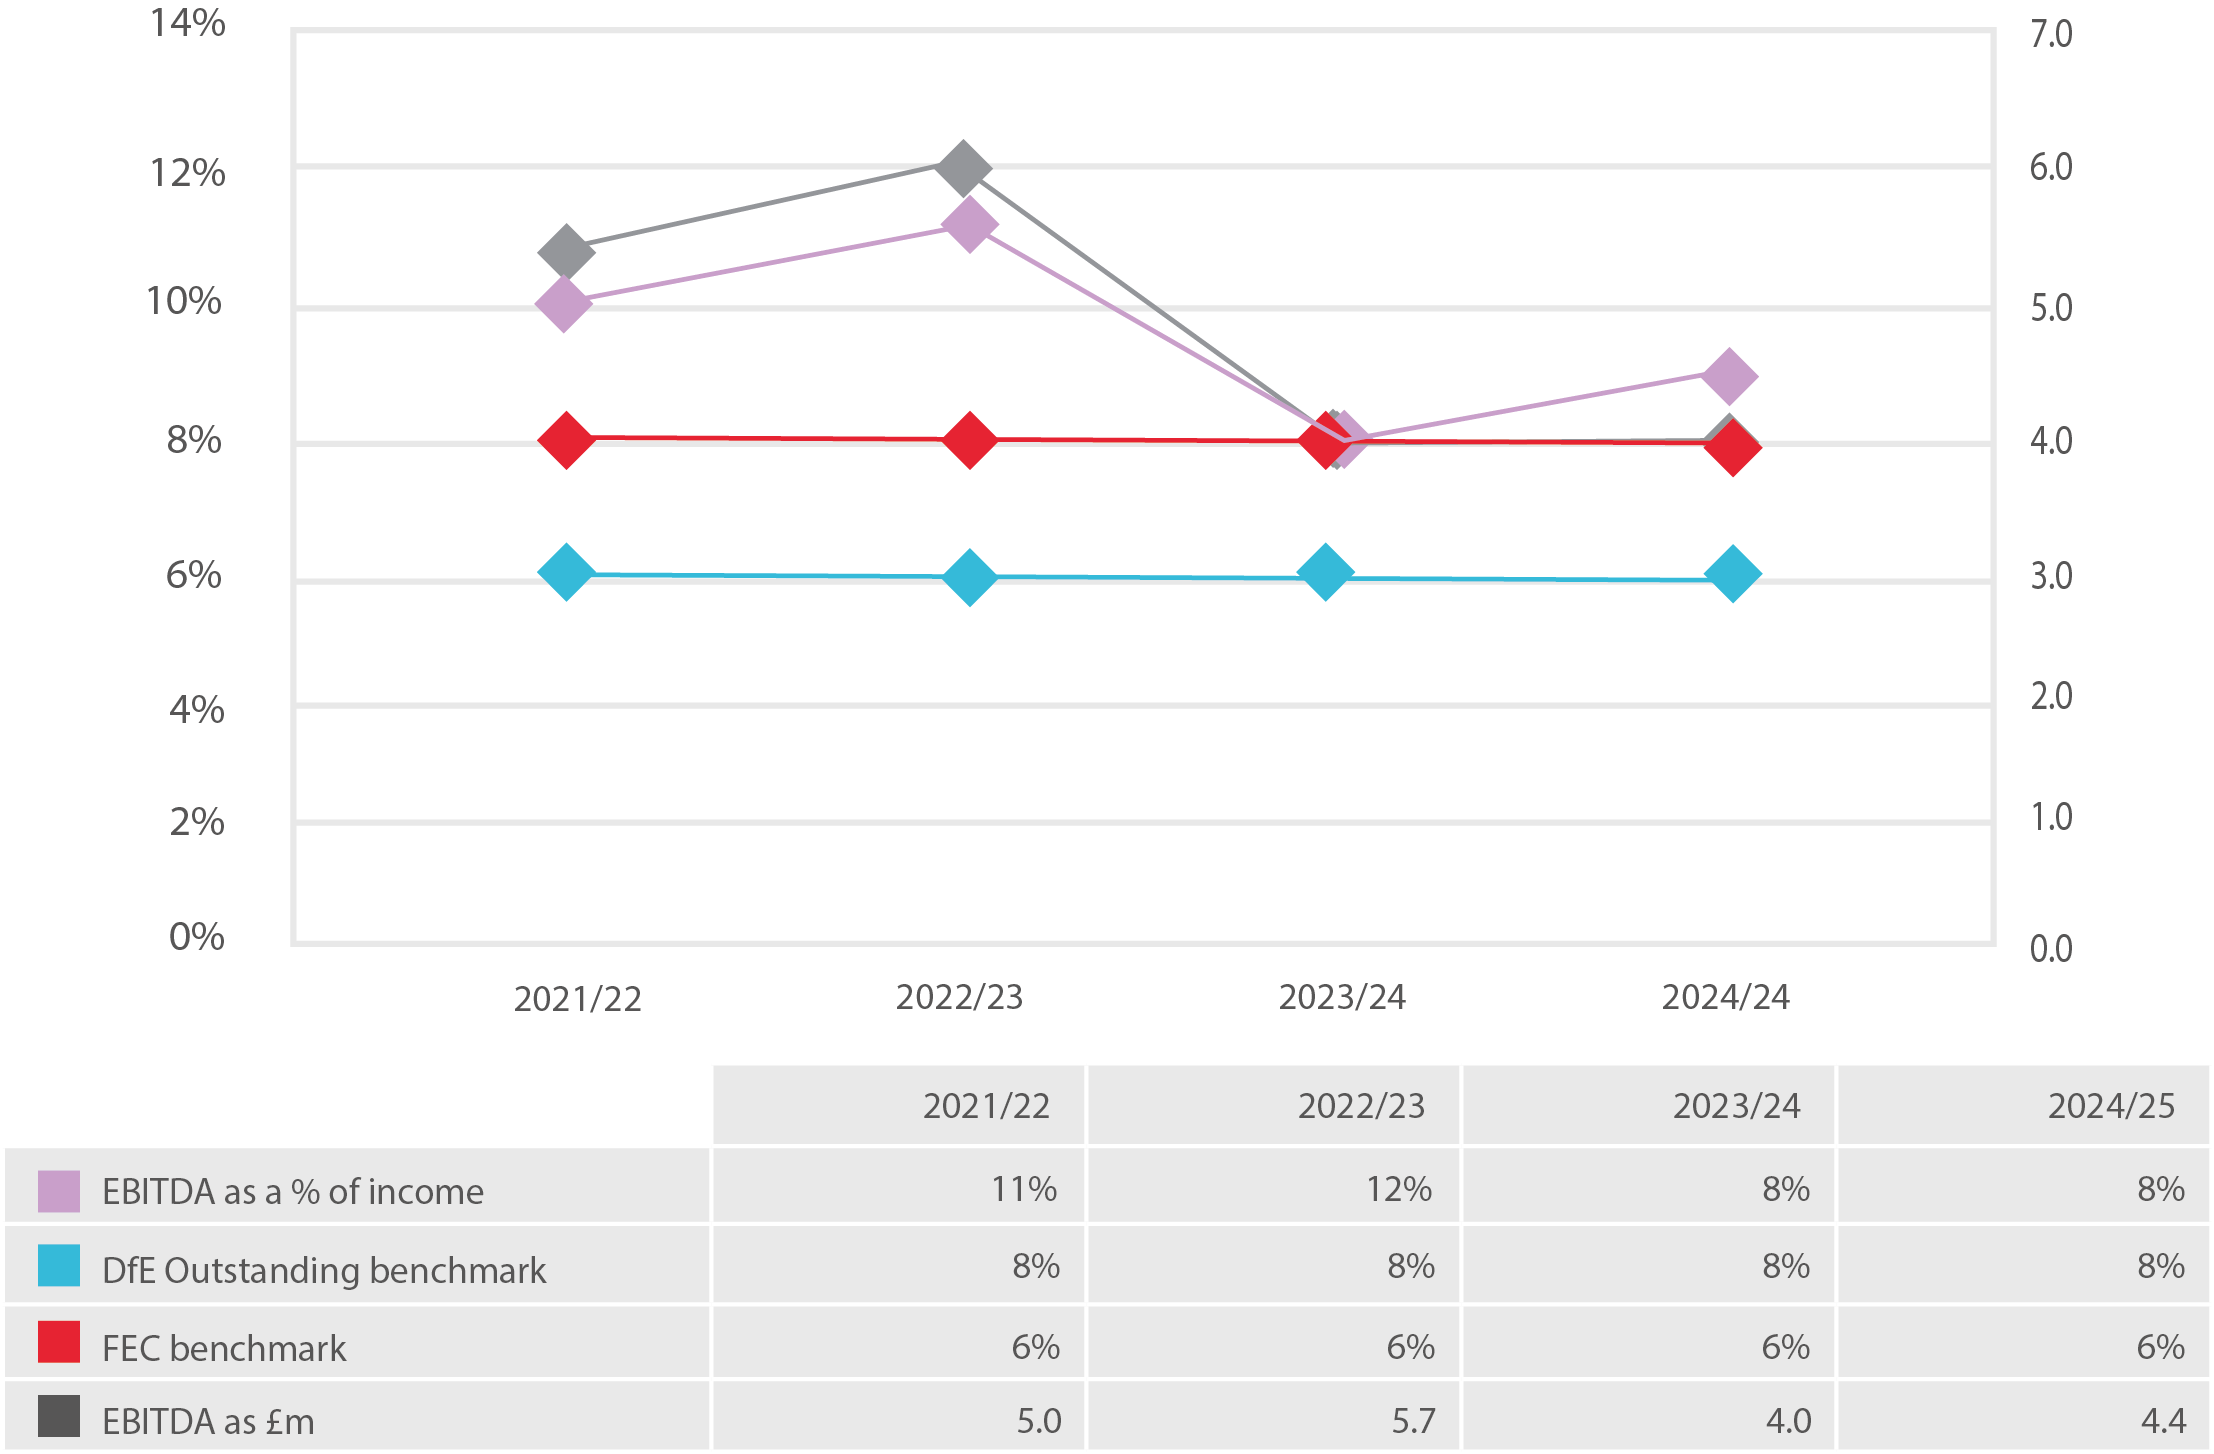
The education specific EBITDA as a percentage of income is a measure of the underlying operating strength of the college. The higher the percentage measure, the stronger the operational performance.
The investment made by the college in our Dudley and Brierley Hill Learning Quarters resulted in growth in learner numbers and income. EBITDA has improved by ensuring costs are aligned to recruitment and teaching delivery. At 8.2%, EBITDA has exceeded the FEC benchmark of 6% and the DfE benchmark of Outstanding of 8%.
Total Income
Total Income (£m)
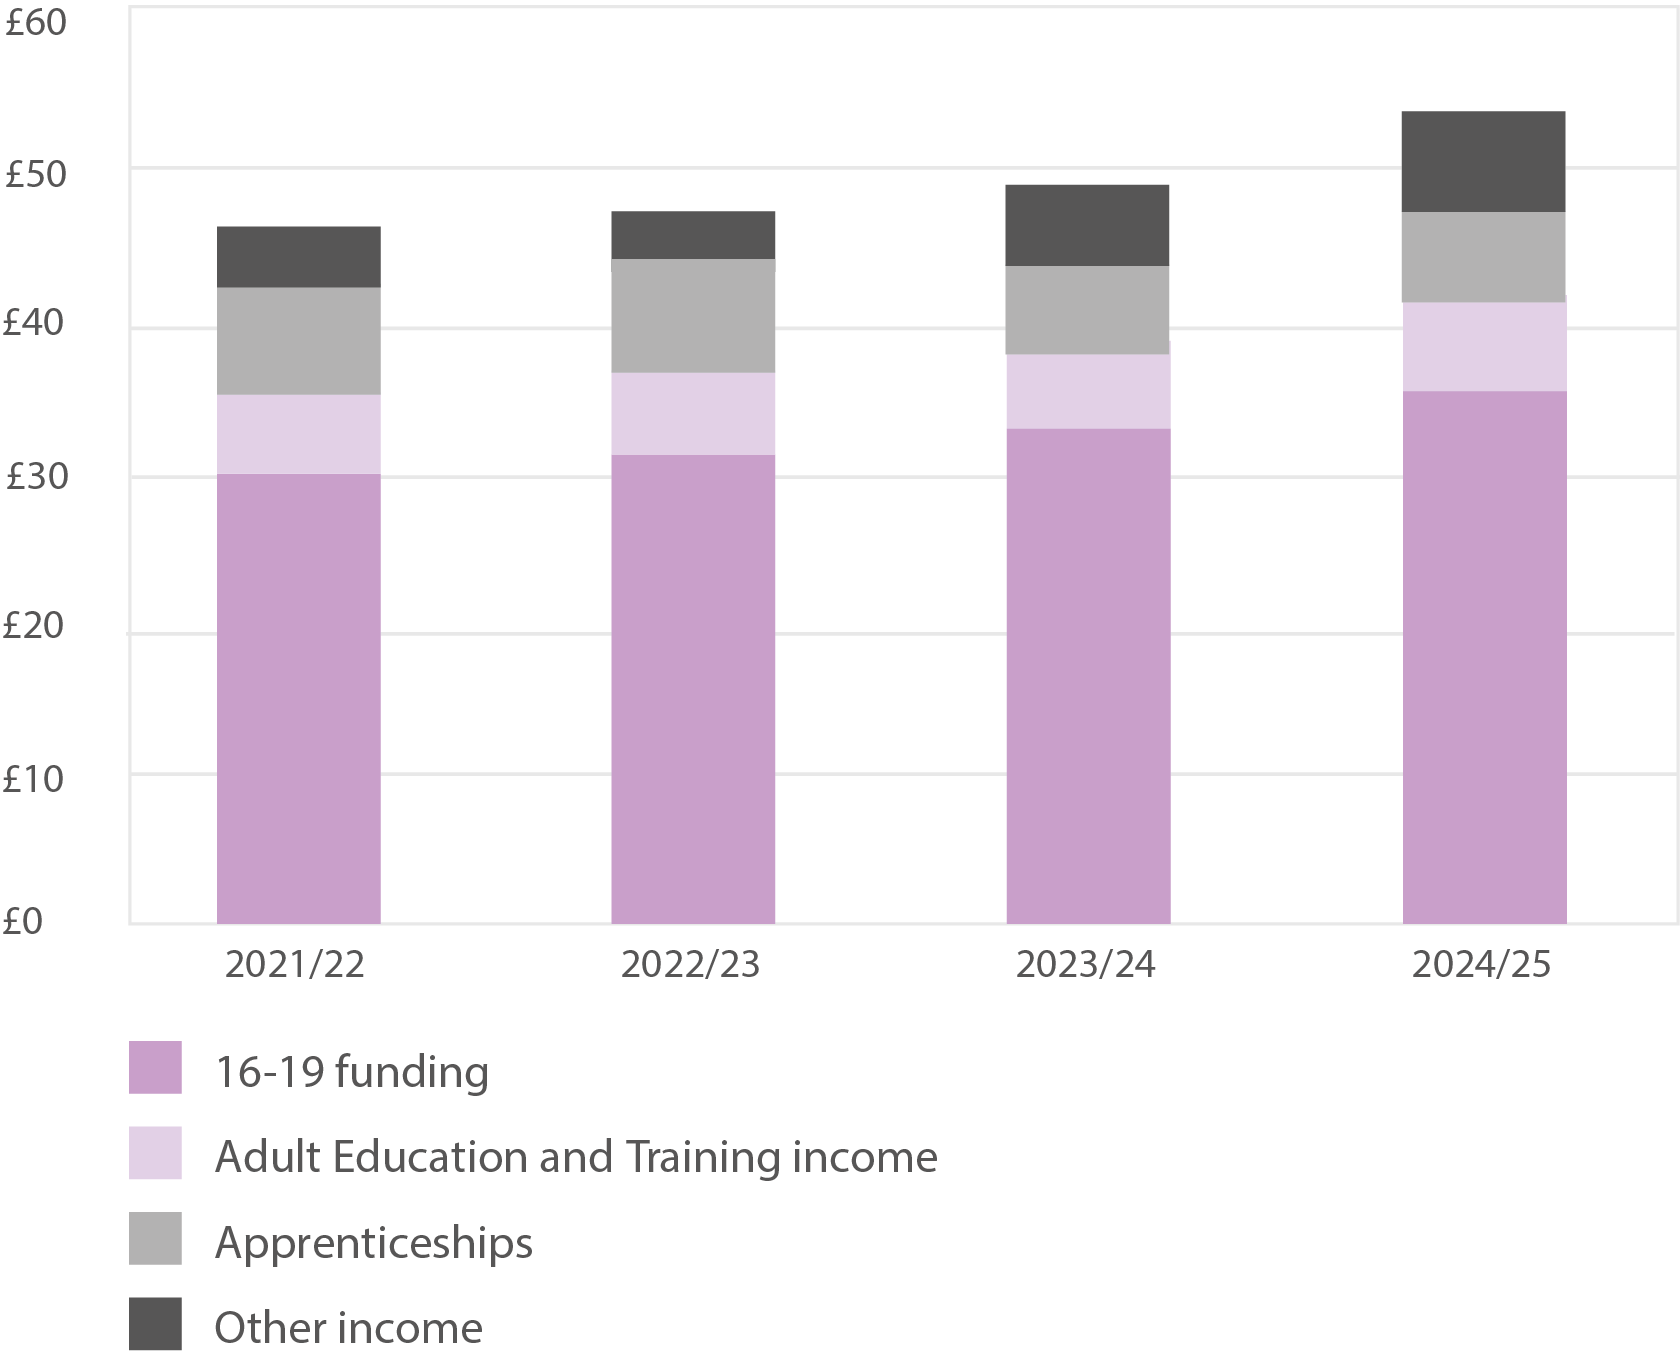
We continue to see increases in income since 2021. The increase in income in 2025 is largely driven through higher levels of DfE funding for students aged 16-19 and this will continue to grow in 2026, based on prior year student numbers. Apprenticeship income has dropped slightly, and this is a managed withdrawal from sub-contracting – the College now delivers all training through its own staff base.
Staff Cost as a Percentage of Income
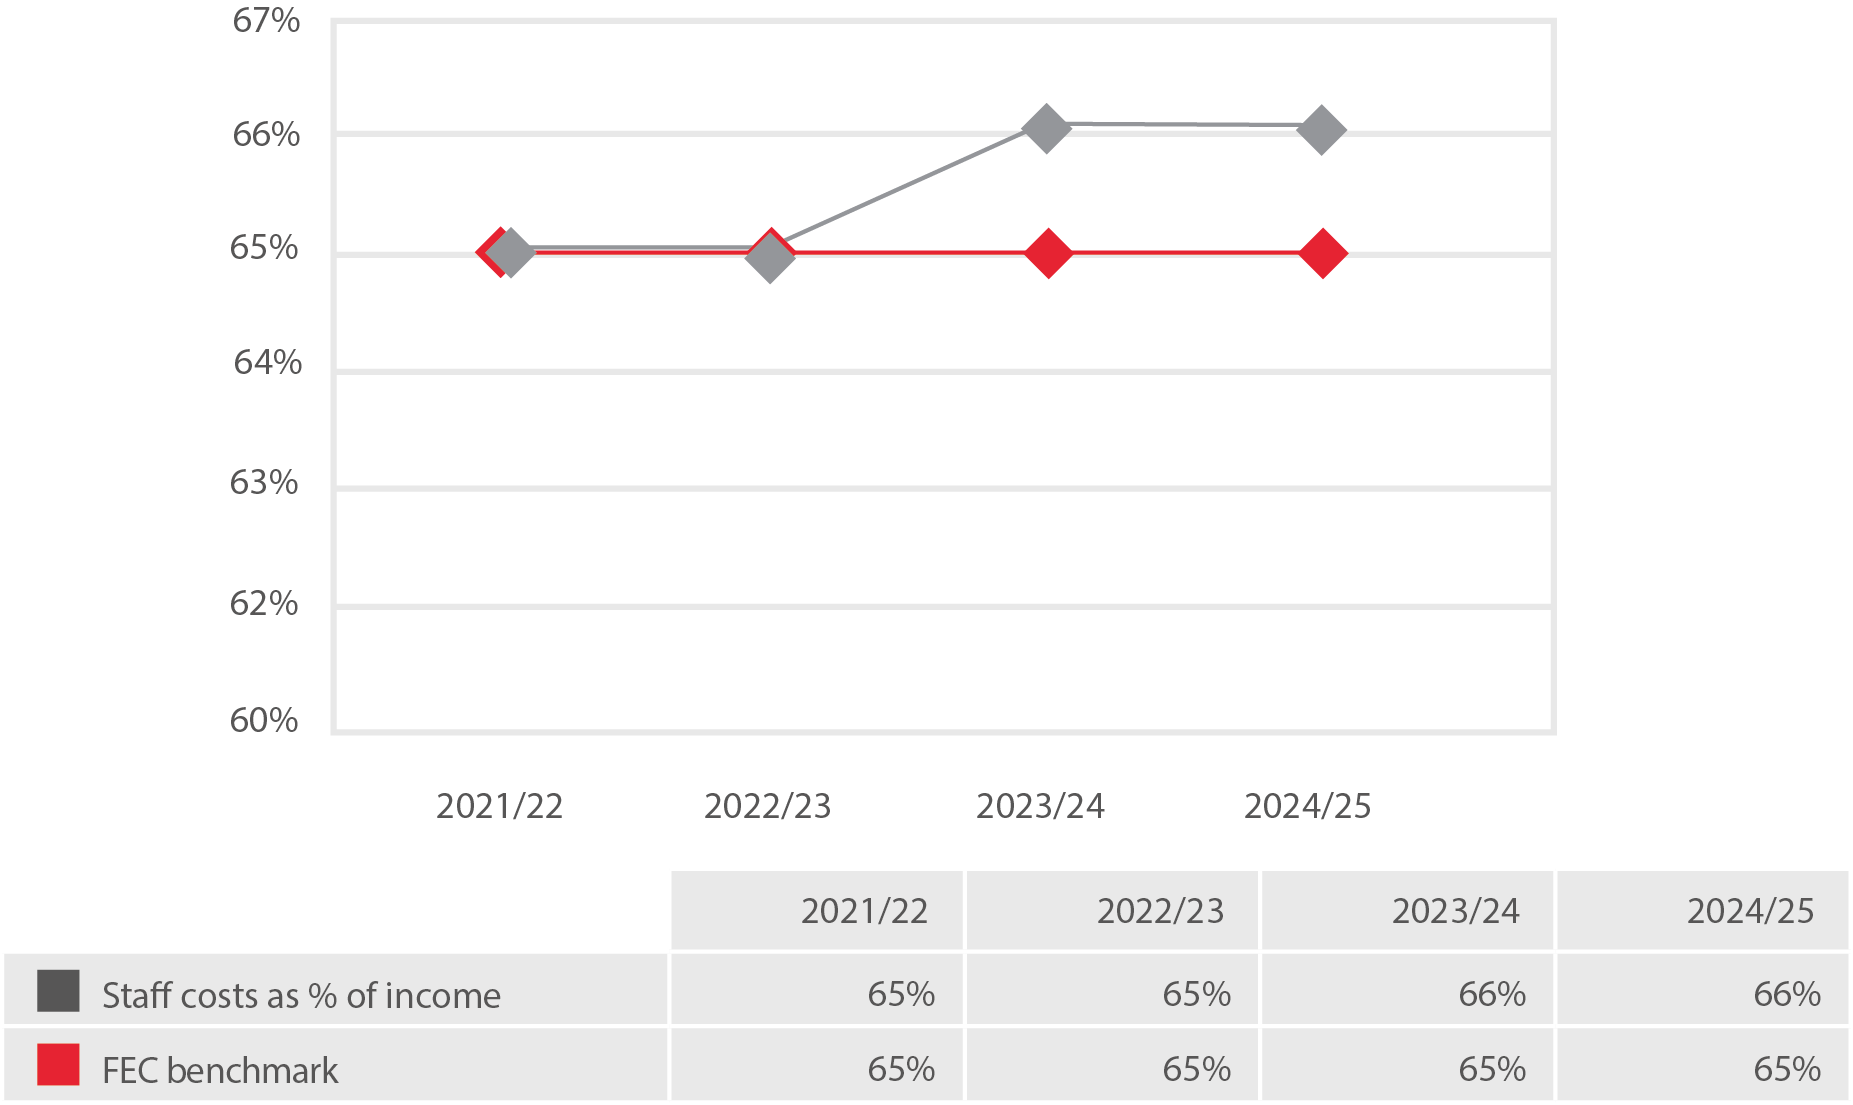
The College is proud to continue to award increases in pay that meet the AoC recommended pay awards for staff. Like all employers, the College has been impacted by increased national insurance contributions and high teachers’ pension costs. We are pleased therefore that our pay costs as a percentage of income remain close to the low FEC benchmark of 65%. Pay costs continue to be tightly controlled and we are careful to ensure that the College’s establishment effectively matches resource requirements.
The college has also been mindful of the need to retain staff with specialist skills in order to remain flexible and respond to emerging demand in the adult and apprenticeship market. Inevitably this puts pressure on pay budgets and increases the risk of carrying vacancies for skilled staff.
Adjusted Current Ratio
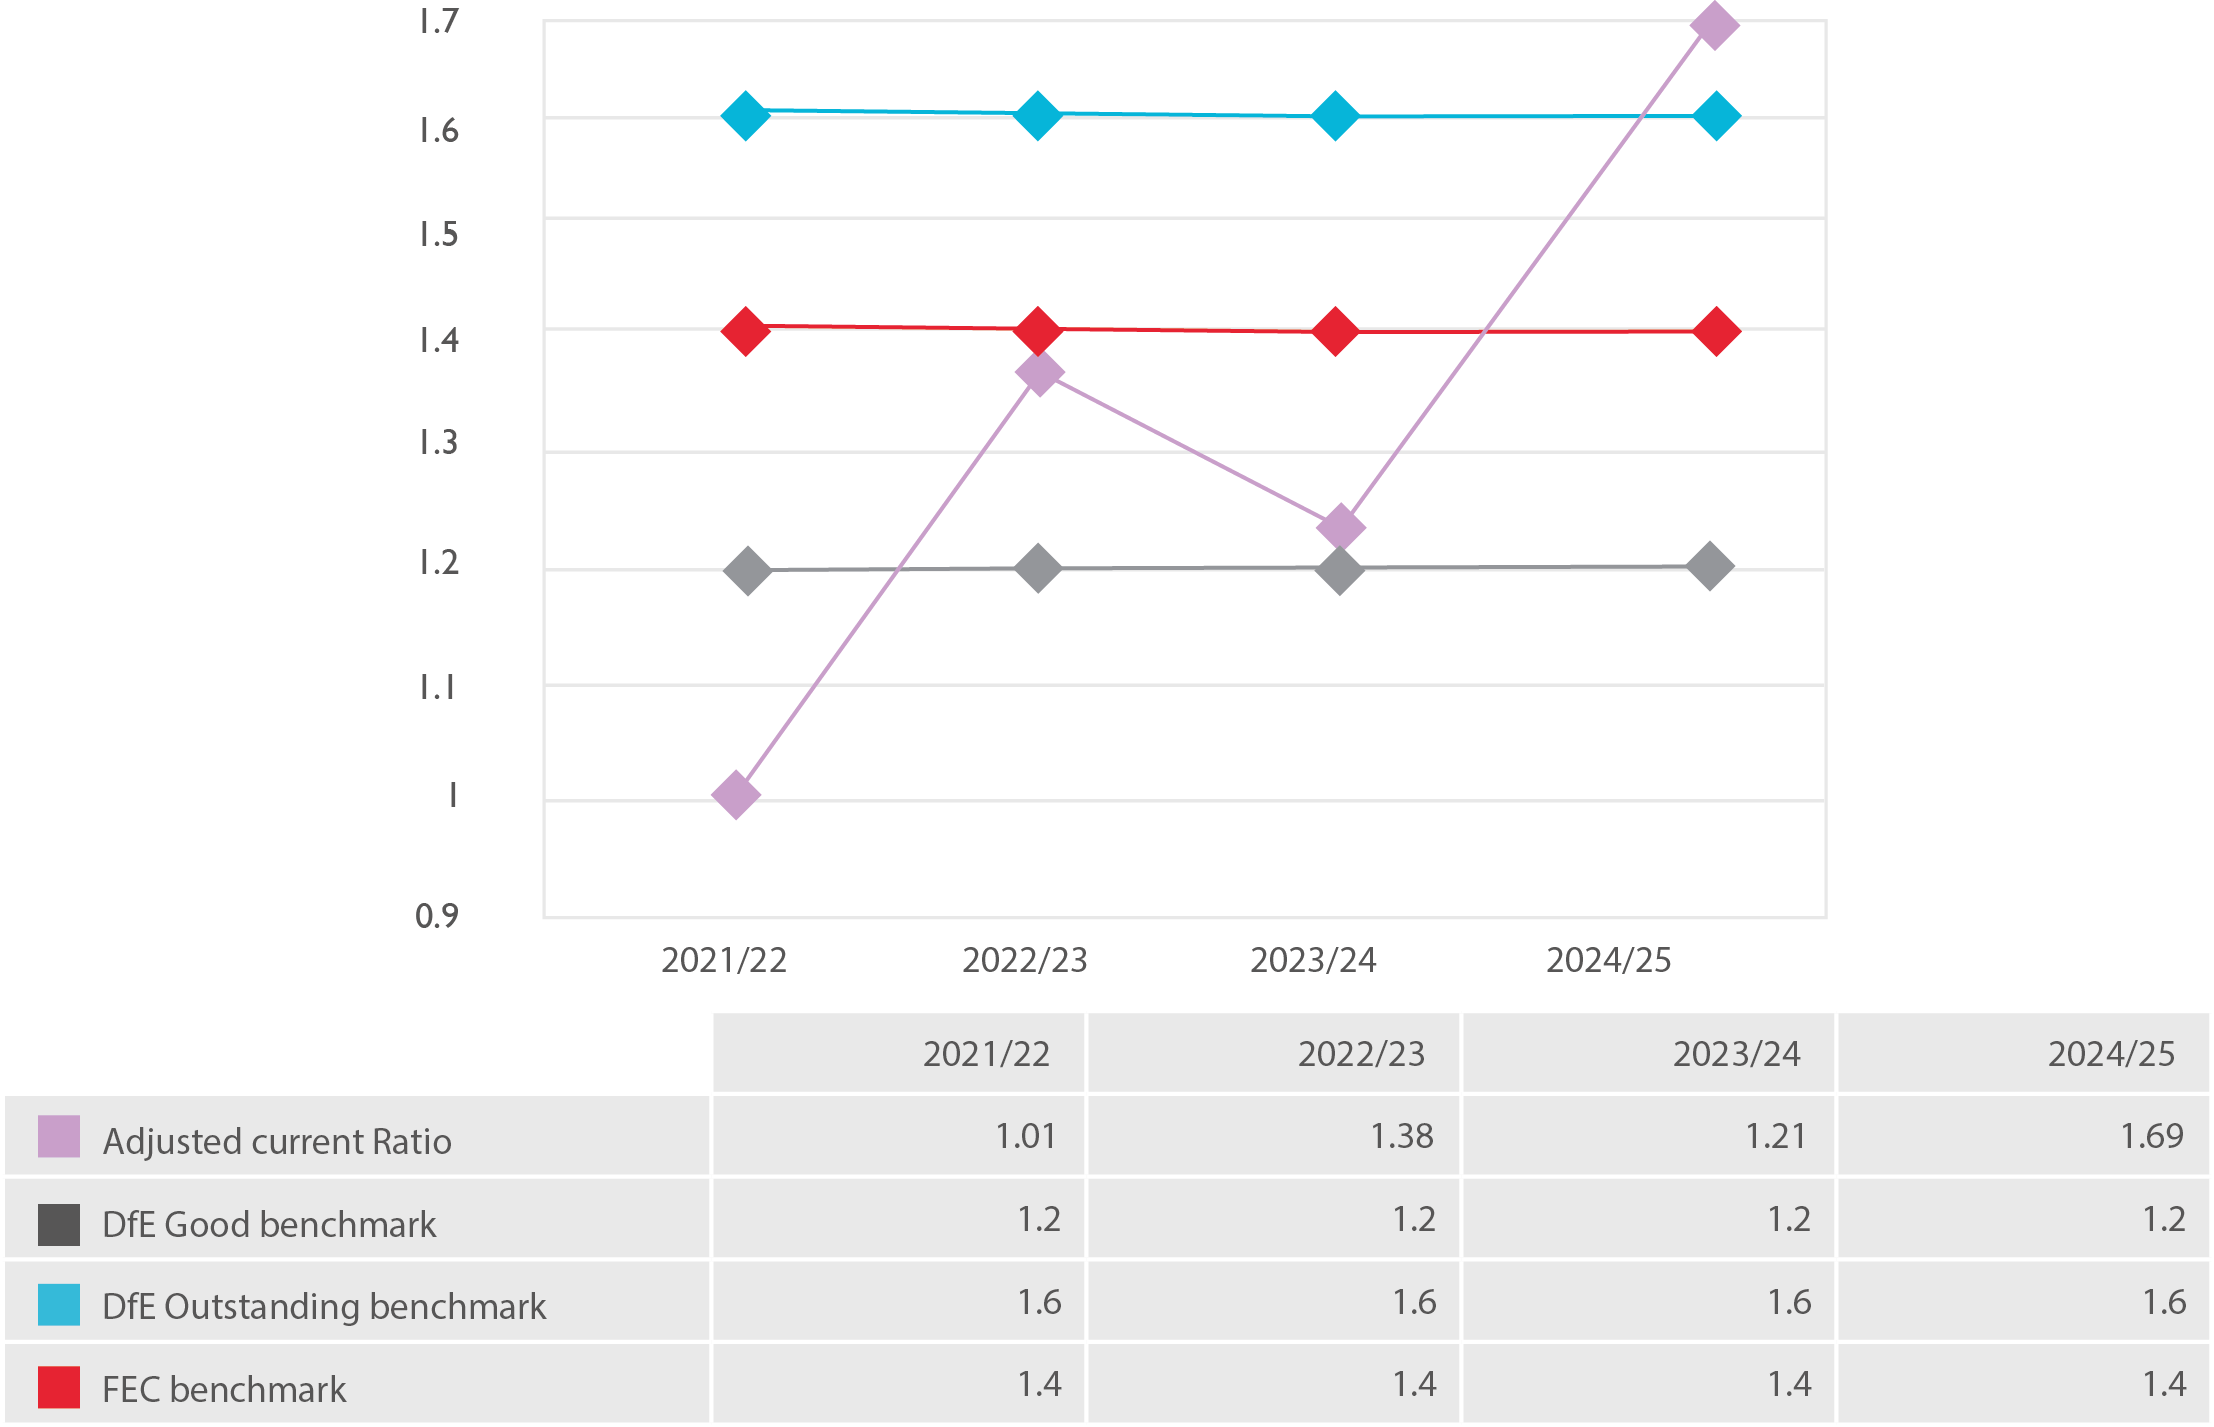
The current ratio is a measure of current assets compared to current liabilities and is used as an indicator of short-term liquidity. Whilst not a direct measure of cash, the higher the percentage measure, which means the more cash, or assets that can be easily converted into cash, a college has got compared to its short-term liabilities. The FEC benchmark is 1.4, which the College has exceeded in 2025. The DfE Outstanding threshold of 1.6 has also been exceeded.
The increase in income and careful cost management has resulted in an improved cash position and therefore a better current ratio. Cash management will continue to be important going forward as we balance the College’s liquidity needs against the requirement to repay borrowing. We anticipate that the College’s current ratio will continue to be strong over the next few years as the college maintains control on costs, targets capital expenditure and has a prudent repayment plan of borrowing.
Cash Days
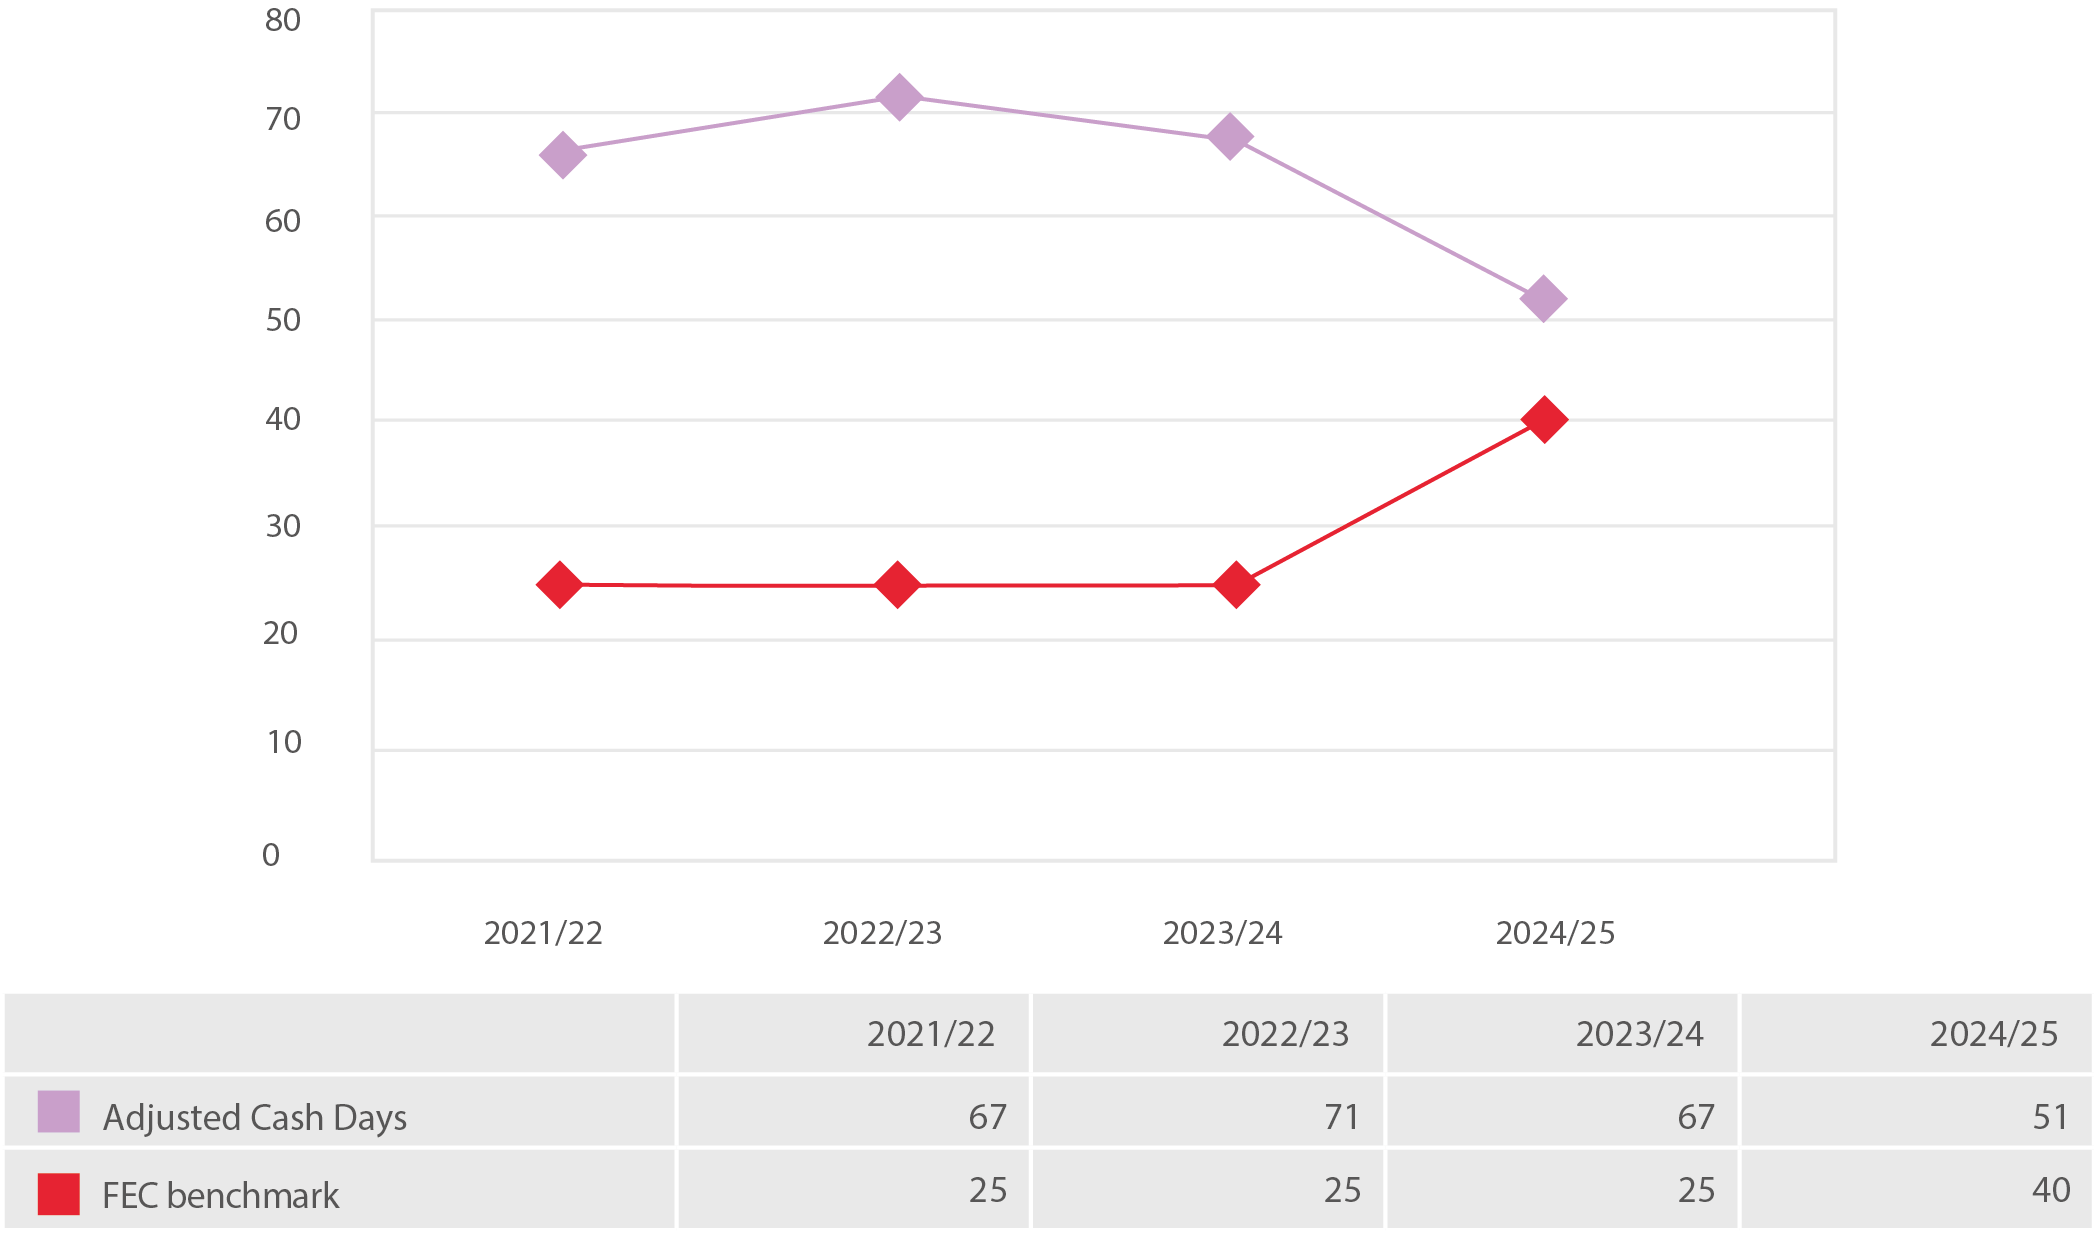
Cash days is the number of days that an organisation can continue to pay its operating expenses given its current level of available cash. The FE Commissioner’s benchmark is for colleges to have sufficient cash to cover 40 cash days (previously 25 days).
Closely managed cash balances, capital investment and costs, has helped to maintain the year-end cash balance and cash days to 51 at 31 July 2025, well above the FE Commissioner benchmark of 40. This does not include restricted cash of £2.1m which represents DfE grants received to improve the condition of the College’s estate.
Cash management will continue to be imperative going forwards as we navigate through an economically challenging period. We anticipate that cash, and cash days, will be maintained well above the FEC target of 40.
Borrowing as a % of Income
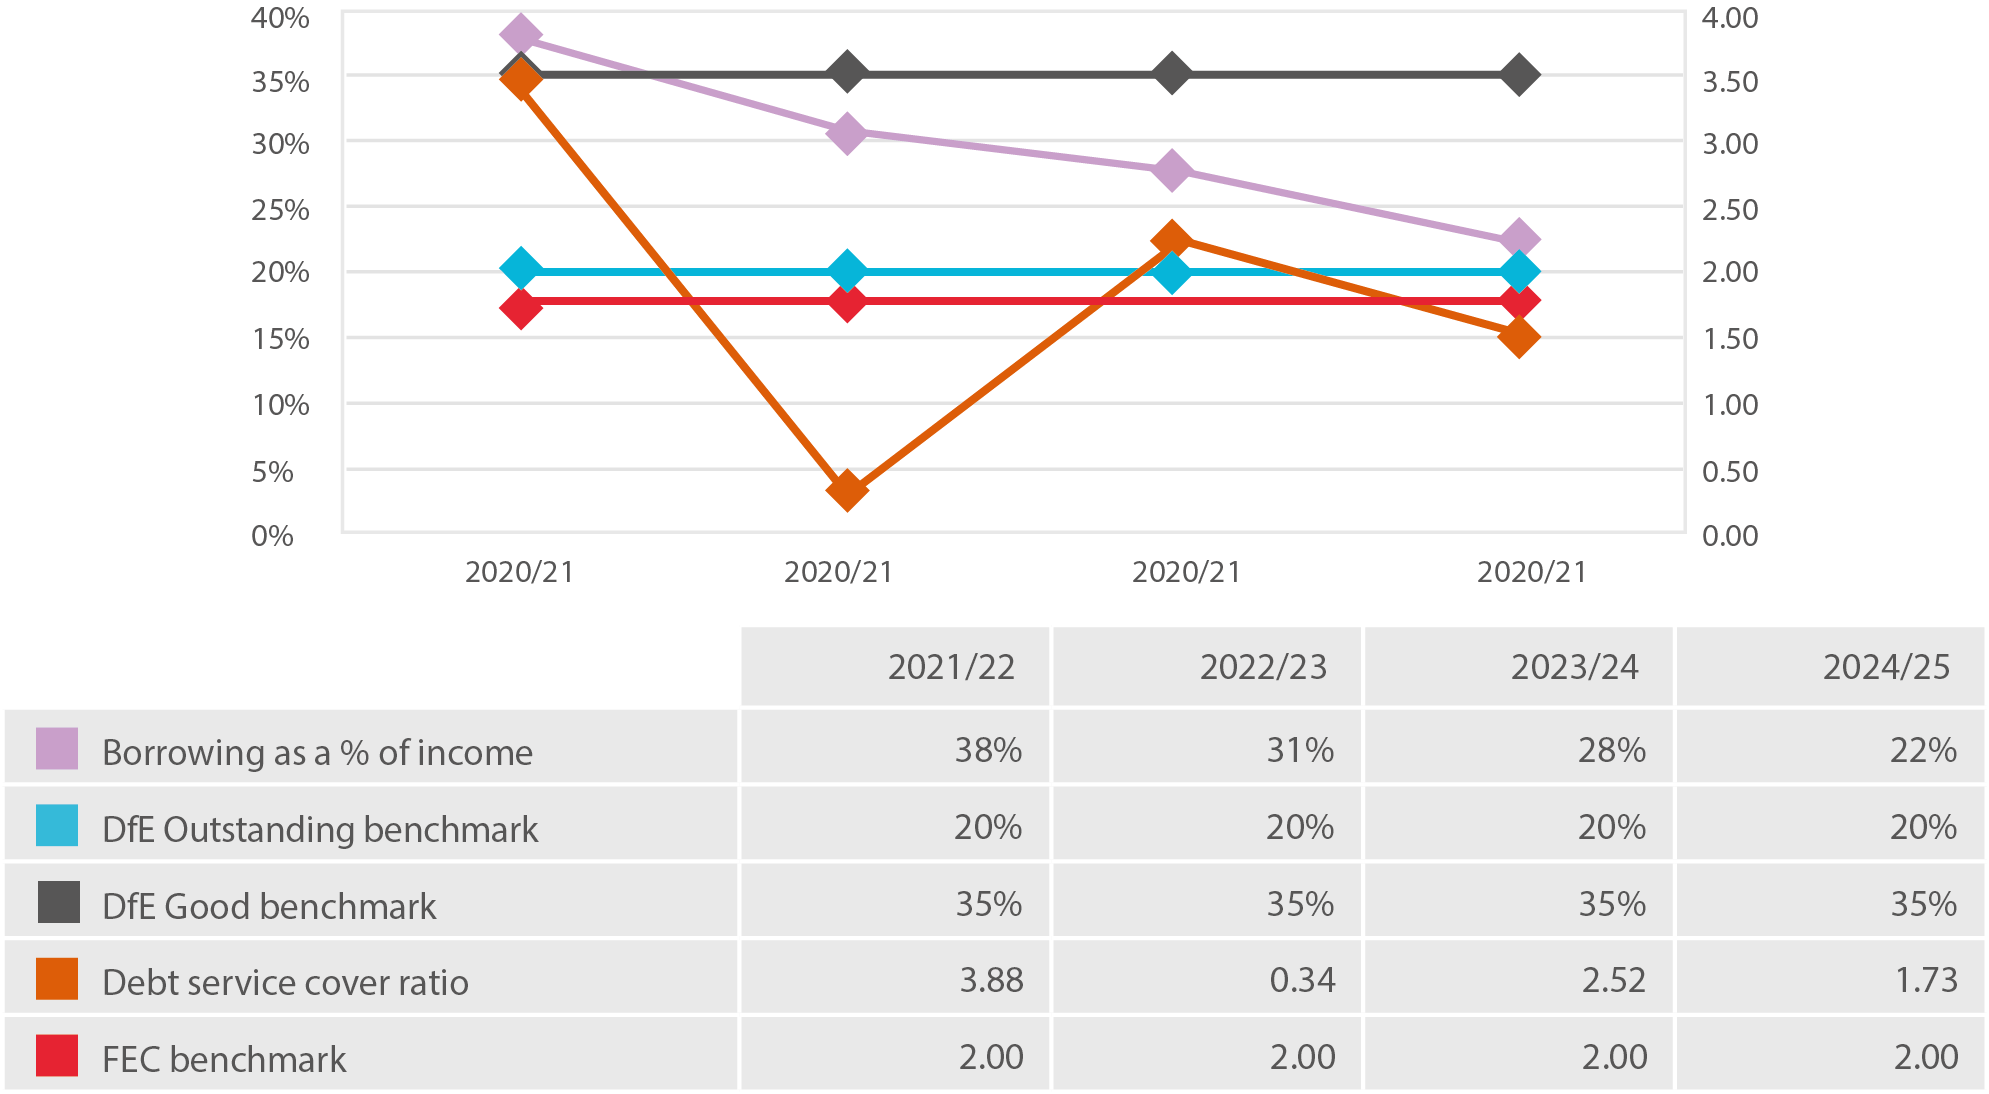
Borrowing as a percentage of income (also known as gearing or leverage) is used to measure the proportion of assets invested in a college that are financed by borrowing. It also provides an indicator to the longer-term financial stability of a college, because the higher the level of borrowing, the higher the risk to a college since more cash will have to be set aside to meet debt and interest repayments leaving less cash for everything else. The lower the percentage measure, the better a college’s gearing, and its prospects for long term stability.
The College has long-term borrowing from Santander and a short-term loan from DfE, the latter will be fully repaid by 2026. No new finance leases have been utilised since 2024, and we continue to focus on reducing the level of debt. This has supported the College’s strategy of improving the strength of our balance sheet and as a percentage of income, borrowing has dropped from 28% to 22% in 2025, now approaching the DfE threshold for Outstanding of 20%.
Debt service cover is a measure of the extent to which cash from operating activities will cover the cost of loan and lease repayments and the interest charged for these facilities. The FEC benchmark is 2 and the college has improved its ratio to just below this at 1.73. We expect this will exceed the FEC benchmark in 2026.
ESFA Financial Health Grade
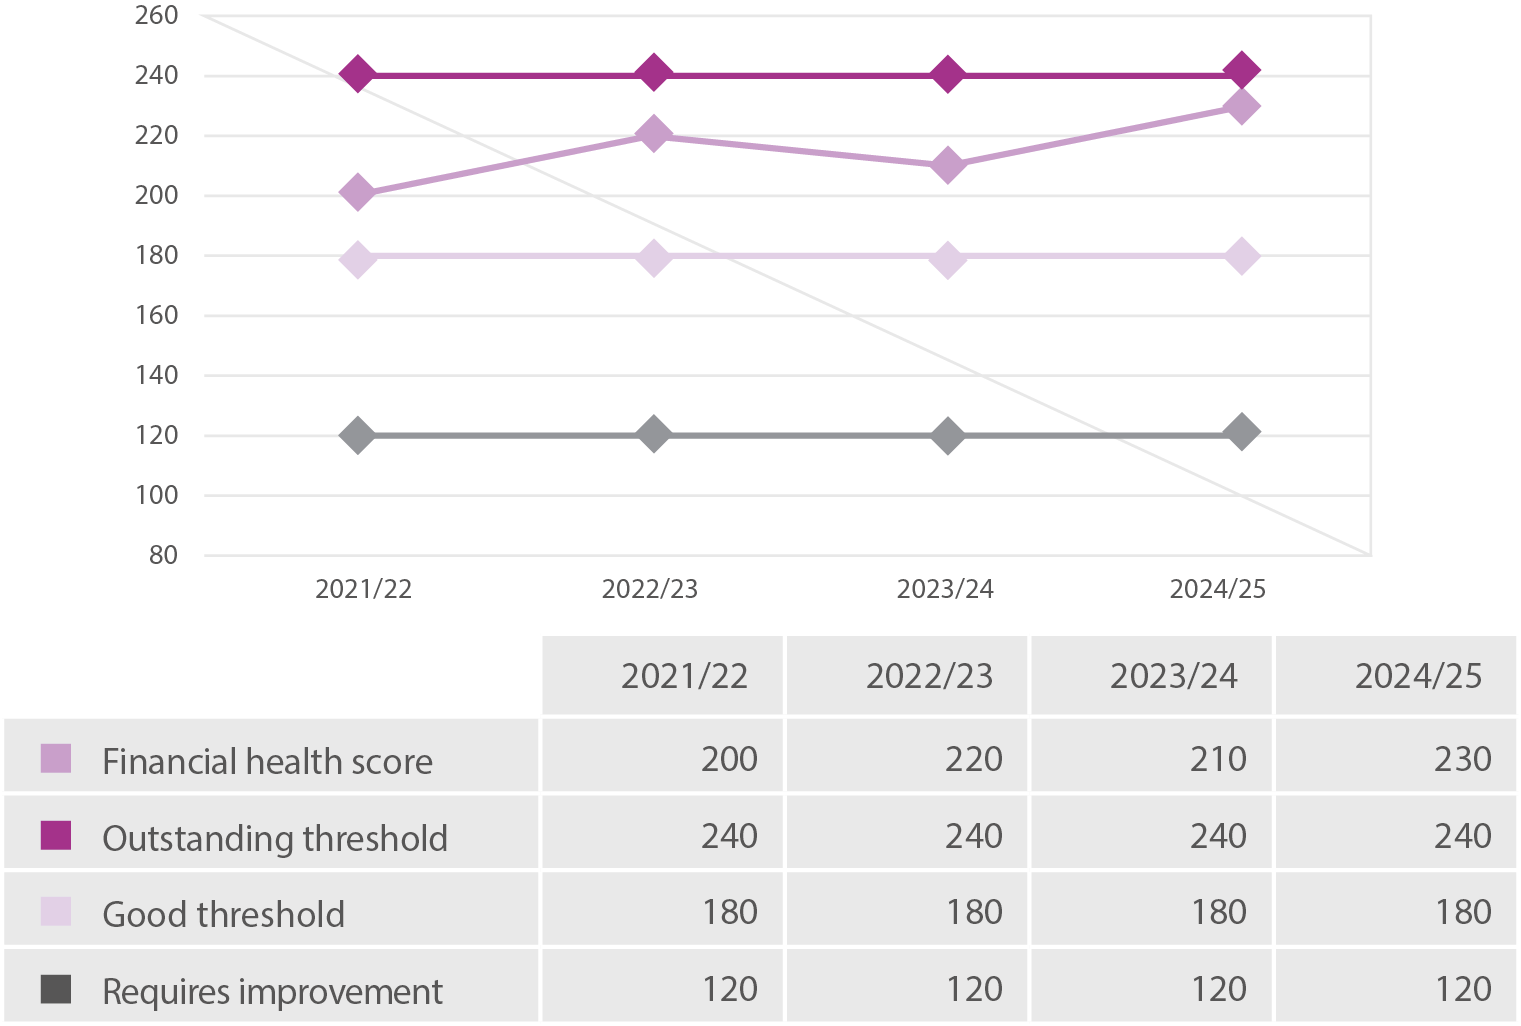
The College’s financial health grade is assessed by scoring the adjusted current ratio, EBITDA as a percentage of adjusted income and borrowing as a percentage of income. The total scores provide an overall financial health grade, based on a banding structure illustrated in the chart.
The improved operating position and higher cash levels have resulted in a strong increase in financial health score of 230 at July 2025, with the College approaching the Outstanding threshold of 240.
The College expects to maintain its Good financial health score into 2026.